

Dow Jones Industrial Average Stocks Trading at new Yearly Lows
This is a chart of how many stocks in the Dow Jones Industrial Average Index are trading at new yearly lows, plotted below a chart of the Dow Jones Industrial Average Index. Areas of strength in this stock market breadth indicator are highlighted with a red background (over bought), and areas of weakness are highlighted with a green background (over sold).
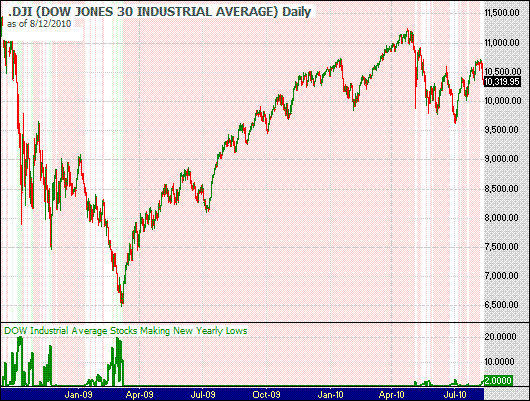
As of right now, 8/12/2010, the indicator is Neutral, with 2 stocks in the Dow Jones Industrial Average index trading at new yearly lows.
Click here for more information on market breadth.
Here are some other Dow Jones Industrial Average market breadth indicators that may be of interest:
Dow Jones Industrial Average stocks trading at new yearly highs
Dow Jones Industrial Average stocks trading above their 200 day moving average
Dow Jones Industrial Average stocks trading above their 50 day moving average
Dow Jones Industrial Average stocks trading above their 40 day moving average
|
|